


Halaman yang Anda Cari Tidak Tersedia
Halaman yang Anda Cari Tidak Tersedia
| Shareholders | December 31, 2023 | December 31, 2022 | ||
|---|---|---|---|---|
| Number of Shares | % | Number of Shares | % | |
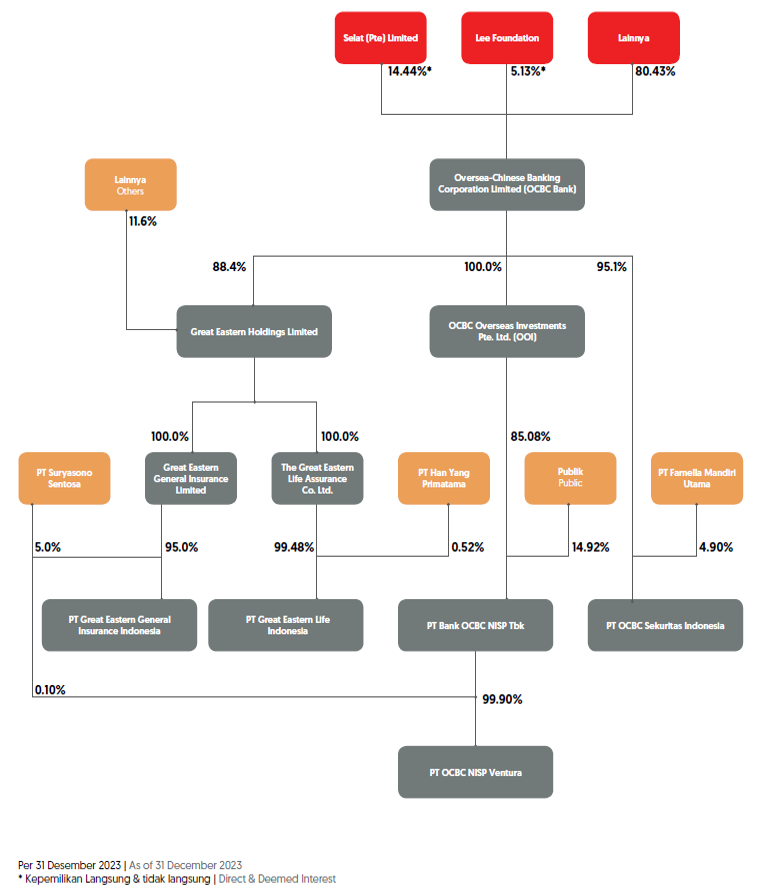
| OCBC Overseas Investments Pte. Ltd. (Controlling Shareholder) |
19,521,391,224 | 85.08% | 19,521,391,224 | 85.08% |
| Board of Commissioners: | ||||
| Pramukti Surjaudaja | 451,942 | 0.00% | 451,942 | 0.00% |
| Board of Directors: | ||||
| Parwati Surjaudaja | 3,208,420 | 0.01% | 3,166,420 | 0.01% |
| Emilya Tjahjadi | 216,000 | 0.00% | 180,000 | 0.00% |
| Hartati | 216,000 | 0.00% | 180,000 | 0.00% |
| Martin Widjaja | 216,000 | 0.00% | 180,000 | 0.00% |
| Andrae Krishnawan W | 216,000 | 0.00% | 180,000 | 0.00% |
| Johannes Husin | 216,000 | 0.00% | 180,000 | 0.00% |
| Joseph Chan Fook Onn | 216,000 | 0.00% | 180,000 | 0.00% |
| Ka Jit | 108,000 | 0.00% | 72,000 | 0.00% |
| Lili S, Budiana | 108,000 | 0.00% | 72,000 | 0.00% |
| Other Shareholders (Ownership below 5%) | 3,418,733,386 | 14.91% | 3,419,063,386 | 14.91% |
| Total | 22,945,296,972 | 100.00% | 22,945,296,972 | 100.00% |
Top 20 Shareholders
As of 29 February 2024
| No. | Shareholders | Number of Shares | % |
|---|---|---|---|
| 1 | OCBC OVERSEAS INVESTMENTS PTE,LTD | 19,521,391,224 | 85.08 |
| 2 | PT UDAYAWIRA UTAMA | 497,950,936 | 2.17 |
| 3 | PT SURYASONO SENTOSA | 494,512,602 | 2.16 |
| 4 | BP2S LONDON S/A ABERDEEN STANDARD ASIA FOCUS PLC | 343,531,866 | 1.50 |
| 5 | THE NT TST CO S/A CAM-GTF VCC | 166,869,284 | 0.73 |
| 6 | JPMCB NA RE-PACIFIC ASSETS TRUST PLC | 150,252,000 | 0.65 |
| 7 | PT AMB FINANSIAL INDONESIA | 130,000,000 | 0.57 |
| 8 | DRS, LO KHENG HONG | 122,079,700 | 0.53 |
| 9 | JOHAN SUNDJOTO | 101,323,000 | 0.44 |
| 10 | THE NT TST CO S/A RAIC VCC | 87,858,852 | 0.38 |
| 11 | JPMCB NA AIF CLT RE-THE SCOTTISH ORIENTAL SMALLER COMPANIES TRUST PLC | 86,000,700 | 0.37 |
| 12 | PANIN SEKURITAS. PT | 74,292,508 | 0.32 |
| 13 | MANOJ PITAMBER NANWANI | 44,283,200 | 0.19 |
| 14 | PT SURYA ANUGRAH MULYA | 35,000,000 | 0.15 |
| 15 | DRS SURONO SUBEKTI | 19,200,000 | 0.08 |
| 16 | ANDY TANUJAYA | 19,116,800 | 0.08 |
| 17 | UBS AG LONDON-2140724000 | 18,601,254 | 0.08 |
| 18 | TEKARDJO ANGKASA | 16,921,500 | 0.07 |
| 19 | PURYANTO | 15,360,600 | 0.07 |
| 20 | MUSKAAN ANIL BAHIRWANI | 15,000,000 | 0.07 |
Quarterly Published Report 2023
Quarterly Published Report 2022
Quarterly Published Report 2021
Quarterly Published Report 2020
Quarterly Published Report 2019
Quarterly Published Report 2018
Quarterly Published Report 2017
Quarterly Published Report 2016
Quarterly Financial Report 2023
Quarterly Financial Report 2022
Quarterly Financial Report 2021
Quarterly Financial Report 2020
Quarterly Financial Report 2019
Quarterly Financial Report 2018
Quarterly Financial Report 2017
Quarterly Financial Report 2016
Quarterly Financial Report 2015
Monthly Financial Report 2024
Monthly Financial Report 2023
Monthly Financial Report 2022
Monthly Financial Report 2021
Monthly Financial Report 2020
Monthly Financial Report 2019
Monthly Financial Report 2018
Monthly Financial Report 2017
Performance Presentation 2023
Performance Presentation 2022
Performance Presentation 2021
Performance Presentation 2020
Performance Presentation 2019
Performance Presentation 2018
Performance Presentation 2017
Leverage Ratio 2023
Leverage Ratio 2022
Leverage Ratio 2021
Leverage Ratio 2020
Leverage Ratio 2019
Leverage Ratio 2018
Leverage Ratio 2017
Leverage Ratio 2016
Basel III Disclosure 2023
Basel III Disclosure 2022
Basel III Disclosure 2021
Basel III Disclosure 2020
Basel III Disclosure 2019
Basel III Disclosure 2018
Basel III Disclosure 2017
Basel III Disclosure 2016
Liquidity Coverage Ratio (LCR) 2023
Liquidity Coverage Ratio (LCR) 2022
Liquidity Coverage Ratio (LCR) 2021
Liquidity Coverage Ratio (LCR) 2020
Liquidity Coverage Ratio (LCR) 2019
Liquidity Coverage Ratio (LCR) 2018
Liquidity Coverage Ratio (LCR) 2017
Liquidity Coverage Ratio (LCR) 2016
NSFR (Net Stable Funding Ratio) 2023
NSFR (Net Stable Funding Ratio) 2022
NSFR (Net Stable Funding Ratio) 2021
NSFR (Net Stable Funding Ratio) 2020
NSFR (Net Stable Funding Ratio) 2019
NSFR (Net Stable Funding Ratio) 2018
Quantitative Information of Risk Exposure 2023
Quantitative Information of Risk Exposure 2022
Quantitative Information of Risk Exposure 2021
Quantitative Information of Risk Exposure 2020
Quantitative Information of Risk Exposure 2019
Quantitative Information of Risk Exposure 2018
Quantitative Information of Risk Exposure 2017
In million Rupiah, unless otherwise stated
| Description | 2023 | 2022 | 2021 | 2020 | 2019 |
|---|---|---|---|---|---|
| Statements of Financial Position | |||||
| Total Assets | 249,757,139 | 238,498,560 | 214,395,608 | 206,297,200 | 180,706,987 |
| Total Earning Assets | 238,828,247 | 229,850,198 | 206,098,916 | 200,361,914 | 168,616,528 |
| Loans - Gross | 154,093,917 | 137,621,383 | 120,775,015 | 114,903,280 | 119,046,393 |
| Loans - Net | 146,007,794 | 130,258,491 | 113,228,691 | 109,737,912 | 114,436,825 |
| Deposits from Customers | 181,755,225 | 176,084,993 | 168,050,732 | 159,036,404 | 126,121,499 |
| Current Accounts | 55,254,840 | 55,895,693 | 52,090,261 | 36,771,711 | 25,160,744 |
| Savings Accounts | 46,116,548 | 40,253,434 | 33,025,441 | 30,328,552 | 25,737,207 |
| Time Deposits | 80,383,837 | 79,935,866 | 82,935,030 | 91,936,141 | 75,223,548 |
| Borrowings | 2,737,985 | 4,728,401 | 4,718,556 | 4,709,294 | 1,982,588 |
| Subordinated Debts | 153,970 | 155,675 | 142,525 | 140,500 | 138,825 |
| Total Liabilities | 212,436,871 | 204,287,525 | 182,068,037 | 176,467,884 | 153,042,184 |
| Total Equity | 37,320,268 | 34,211,035 | 32,327,571 | 29,829,316 | 27,664,803 |
| Statements of Profit or Loss and Other Comprehensive Income | |||||
| Net Interest Income | 9,911,536 | 8,740,701 | 7,643,485 | 7,112,768 | 6,438,932 |
| Other Operating Income | 1,401,618 | 1,863,469 | 2,059,246 | 2,249,317 | 1,912,576 |
| Total Operating Income | 11,313,154 | 10,604,170 | 9,702,731 | 9,362,085 | 8,351,508 |
| Allowance for Impairment Losses on Financial Assets and Others | 1,133,120 | 1,722,470 | 2,285,045 | 2,455,852 | 694,849 |
| Other Operating Expenses | 5,011,095 | 4,667,523 | 4,214,269 | 4,125,764 | 3,768,918 |
| Income from Operations | 5,168,939 | 4,214,177 | 3,203,417 | 2,780,469 | 3,887,741 |
| Income Before Tax | 5,184,463 | 4,218,016 | 3,203,792 | 2,784,855 | 3,891,439 |
| Net Income | 4,091,043 | 3,326,930 | 2,519,619 | 2,101,671 | 2,939,243 |
| Other Comprehensive (Expense)/Income for The Year, Net of Tax | 348,857 | (938,719) | (21,414) | 331,943 | 297,206 |
| Total Comprehensive Income for The Year, Net of Tax |
4,439,900 | 2,388,211 | 2,498,205 | 2,433,614 | 3,236,449 |
| Net Income Attributable to: | |||||
| Owners of the Parent | 4,091,028 | 3,326,917 | 2,519,574 | 2,101,670 | 2,939,241 |
| Non-Controlling Interests | 15 | 13 | 45 | 1 | 2 |
| Total Comprehensive Income Attributable to | |||||
| Owners of the Parent | 4,439,885 | 2,388,198 | 2,498,160 | 2,433,613 | 3,236,447 |
| Non-Controlling Interests | 15 | 13 | 45 | 1 | 2 |
| Earnings per Share (Full Amount) | 178.30 | 144.99 | 109.81 | 91.59 | 128.10 |
| Financial Ratios, Compliance and Others | |||||
| Financial Ratios | |||||
| Capital Adequacy Ratio (CAR) | 23.69% | 21.53% | 23.05% | 22.04% | 19.17% |
| Non Performing Loan (NPL) Gross | 1.64% | 2.42% | 2.36% | 1.93% | 1.72% |
| Non Performing Loan (NPL) Net | 0.58% | 0.96% | 0.91% | 0.79% | 0.78% |
| Return on Assets (ROA) | 2.14% | 1.86% | 1.55% | 1.47% | 2.22% |
| Return on Equity (ROE) | 12.00% | 10.51% | 8.33% | 7.47% | 11.56% |
| Net Interest Margin (NIM) | 4.35% | 4.04% | 3.82% | 3.96% | 3.96% |
| Operating Expenses to Operating Income Ratio (BOPO) | 71.01% | 71.09% | 76.50% | 81.13% | 74.77% |
| Loan to Deposit Ratio (LDR) | 83.80% | 77.22% | 71.70% | 71.81% | 94.08% |
| Loan to Funding Ratio (LFR) | 82.49% | 75.14% | 69.69% | 69.31% | 91.14% |
| Macroprudential Intermediation Ratio | 84.79% | 78.26% | 71.07% | 71.82% | 94.86% |
| Net Stable Funding Ratio (NSFR) | 134.82% | 139.60% | 152.84% | 151.63% | 125.00% |
| Current Account & Saving Account (CASA) | 55.77% | 54.60% | 50.65% | 42.19% | 40.36% |
| Liquidity Coverage Ratio (LCR) | 206.16% | 177.98% | 229.23% | 207.56% | 149.74% |
| Compliance Ratios | |||||
| Percentage Breach of Legal Lending Limit | |||||
| Related Parties | - | - | - | - | - |
| Non Related Parties | - | - | - | - | - |
| Percentage Excess of Legal Lending Limit | |||||
| Related Parties | - | - | - | - | - |
| Non Related Parties | - | - | - | - | - |
| Minimum Reserve Requirement | |||||
| Rupiah Statutory Reserve * | 8.08% | 8.42% | 5.86% | 3.02% | 6.02% |
| Macroprudential Liquidity Buffer | 32.44% | 32.51% | 36.85% | 25.44% | 21.66% |
| Statutory Reserves Foreign Currency | 4.01% | 4.01% | 4.01% | 4.26% | 8.44% |
| Net Open Position (NOP) | 1.55% | 2.56% | 3.47% | 1.65% | 3.28% |
| Others | |||||
| Net Income to Income from Operations Ratio | 36.16% | 31.37% | 25.97% | 22.45% | 35.19% |
| Liabilities to Equity Ratio | 569.23% | 597.14% | 563.20% | 591.59% | 553.20% |
| Liabilities to Assets Ratio | 85.06% | 85.66% | 84.92% | 85.54% | 84.69% |
| Other Main Indicators | |||||
| Number of Employees | 6,159 | 5,819 | 5,777 | 5,985 | 5,949 |
| Number of Office Networks | 199 | 200 | 211 | 236 | 283 |
| Number of ATMs | 496 | 496 | 537 | 592 | 669 |
| Issued and fully paid (22,945,296,972 shares) | 2,868,162 | 2,868,162 | 2,868,162 | 2,868,162 | 2,868,162 |
*Previously called Primary Minimum Statutory Reserve
Notes:Merger Information
Financial Statements of Parent Entity (OCBC Bank) - 2023
Financial Statements of Parent Entity (OCBC Bank) - 2022
Financial Statements of Parent Entity (OCBC Bank) - 2021
Financial Statements of Parent Entity (OCBC Bank) - 2020
Financial Statements of Parent Entity (OCBC Bank) - 2019
Financial Statements of Parent Entity (OCBC Bank) - 2018
Financial Statements of Parent Entity (OCBC Bank) - 2017
Financial Statements of Parent Entity (OCBC Bank) - 2016